
A thermal camera layout has to answer two questions: can you see the area you need to monitor, and will the features that matter occupy enough pixels? The GRAYESS field of view calculator helps you explore both before choosing a lens or mounting position. Place cameras and line scanners in the drawing, compare their coverage, and see how distance and viewing angle affect resolution on the target.
What the FOV calculator tells you
Field of view (FOV) describes the angle a device sees. Working distance turns that angle into a span on the target. The calculator draws a two-dimensional section through a flat target and compares up to six devices in one layout.
- Coverage and placement. Adjust distance, offset and aim to find practical mounting positions. See where fields of view overlap and where gaps remain. Drag devices, use keyboard controls or edit dimensions directly on the drawing.
- Resolution across the target. Read projected pixel or scanner sample sizes and compare their minimum and maximum values in the table. Check horizontal and vertical FOV separately for area cameras.
- Hot spot sampling. Enter a feature width and choose a threshold from 1 to 4 local pixel or sample footprints. Red target segments show covered regions where no device meets that threshold. Uncovered regions are not marked red, so check the field-of-view boundaries too.
- Camera and scanner options. Choose catalog models and lenses, or enter custom optical values. Line scanner settings distinguish the full scan angle from a narrower working FOV. Cropping a scan uses fewer samples; it does not improve their spacing.
Understand the coverage and resolution tradeoff
For a camera facing a flat target straight on, coverage = 2 × distance × tan(FOV / 2). Dividing this span by the detector pixel count gives the projected pixel size. A wider lens covers more at the same distance, while a narrower lens gives a small feature more pixels. Higher detector resolution can provide more detail without reducing coverage.
An angled camera stretches pixel footprints toward the far side of its view. Rotating-mirror scanners use equal angular sampling, so their sample footprints grow toward the scan edges even when aimed straight at the target. A layout that looks adequate at the center can therefore fall short near an edge.
The calculator remembers your latest committed settings in the same browser. Use Share to save or send a link containing the layout and its optical values. Each link is a fixed snapshot, so share again after making changes. Download SVG or JPG for a layout document, or CSV for the comparison table.
Three ways to use the calculator
The following layouts use illustrative dimensions and the same sampling requirement: a 100 mm feature spanning at least two local pixel or sample footprints in the selected direction. Select any drawing to open its editable configuration.
Example 1: cover a waste bunker from limited mounting space
Imagine planning thermal monitoring across a wide waste bunker. The room leaves little freedom to move cameras farther back, and a single wide view would spread the available pixels across too much material. Several cameras can divide the task, provided their views overlap and the overlap compensates for the poorer resolution of angled views.
This layout places three A70 cameras about 26 m from a 60 m reference span. Each uses a 51° horizontal FOV and 640 horizontal pixels. The outer cameras look inward at 20°, while the middle camera faces the target directly. Its view bridges the center and overlaps the far edges of both angled views.
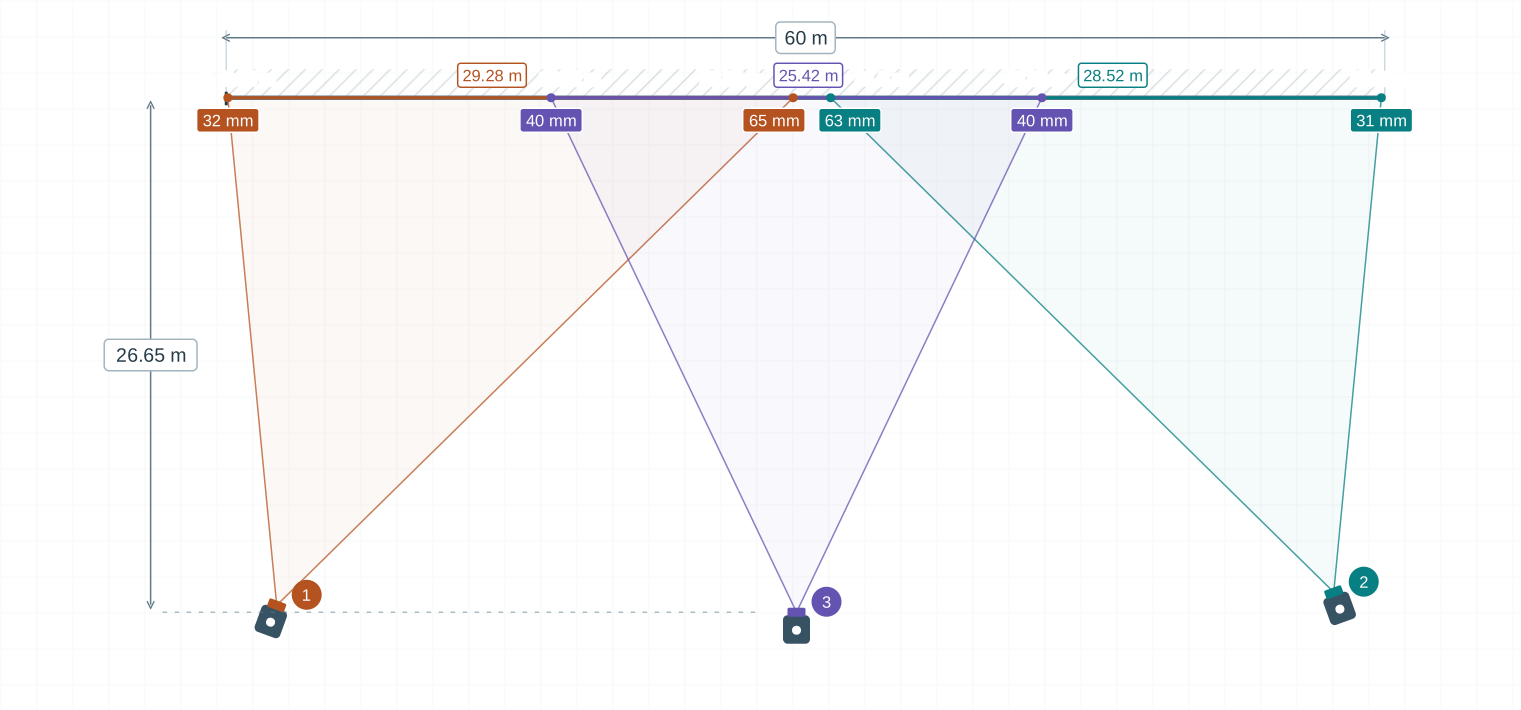
The combined view covers almost the full width and meets the sampling requirement wherever it covers the target. Edge margins under 0.2 m remain, so make a final position adjustment before accepting the layout. This is how the calculator helps fit a coverage plan to available mounting space; pile height, obstructions and coverage in the other direction still need a site check.
Example 2: concentrate hot spot coverage where it matters
A kiln monitoring team may have to work with an existing scanner mounting point. Suppose its monitoring plan requires small hot spots to be resolved in an inlet-side section, shown on the right of this drawing, while the left-hand section needs only a broader temperature overview. The task is to cover the full length and check that the most demanding region receives enough samples.
An MP150/300 scanner about 21.6 m from the target uses a 90° scan with 1,024 samples. Its offset position and oblique aim cover the full 50 m reference length. Sample footprints are smallest near the right-hand part of the target and become larger toward the distant left end.
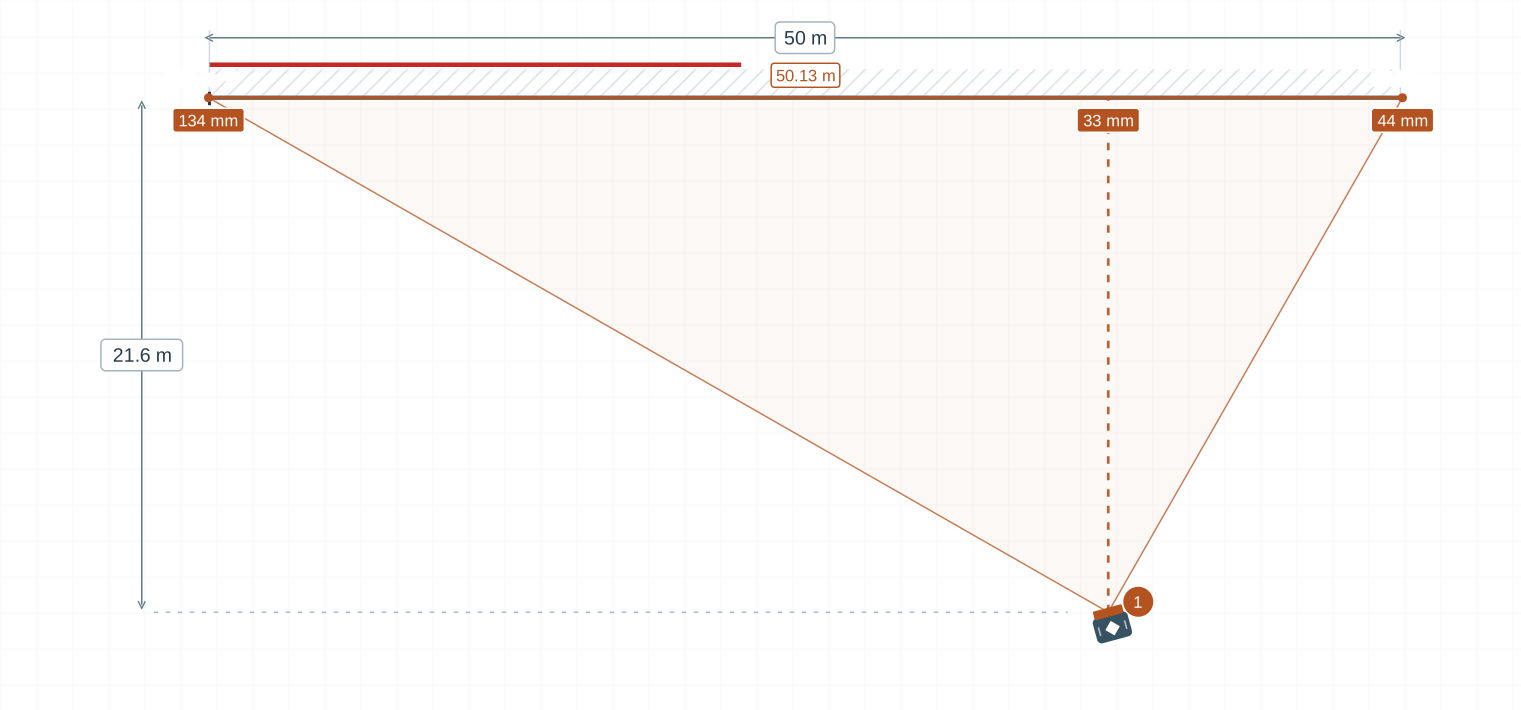
The right-hand portion passes the selected sampling check; roughly the first 22 m on the left does not. The red segment makes that compromise visible. If plant measurements confirm that this is a cooler, less critical region, the layout may suit the monitoring plan. If small hot spots must be resolved there too, reposition the scanner or add another view. The drawing checks sampling geometry, not the kiln's temperature profile or actual detection performance.
Example 3: compare a wider view with finer resolution
A team replacing a kiln scanner wants to reuse an inspection platform about 20 m from the shell. A wider scan would cover more kiln length, but the monitoring plan also calls for a 100 mm hot spot to span at least two samples near the view edges. The drawing places two alternative instruments side by side to compare this tradeoff; they are not intended to cover the 80 m reference span together.
The LSP-HD preset has an 80° scan with 1,000 samples. It covers about 33.6 m, with sample footprints of about 28 to 48 mm. The MP150/300 uses a 90° scan with 1,024 samples and covers about 40 m, with footprints of about 31 to 61 mm. Its slightly higher sample count does not offset the wider scan angle.
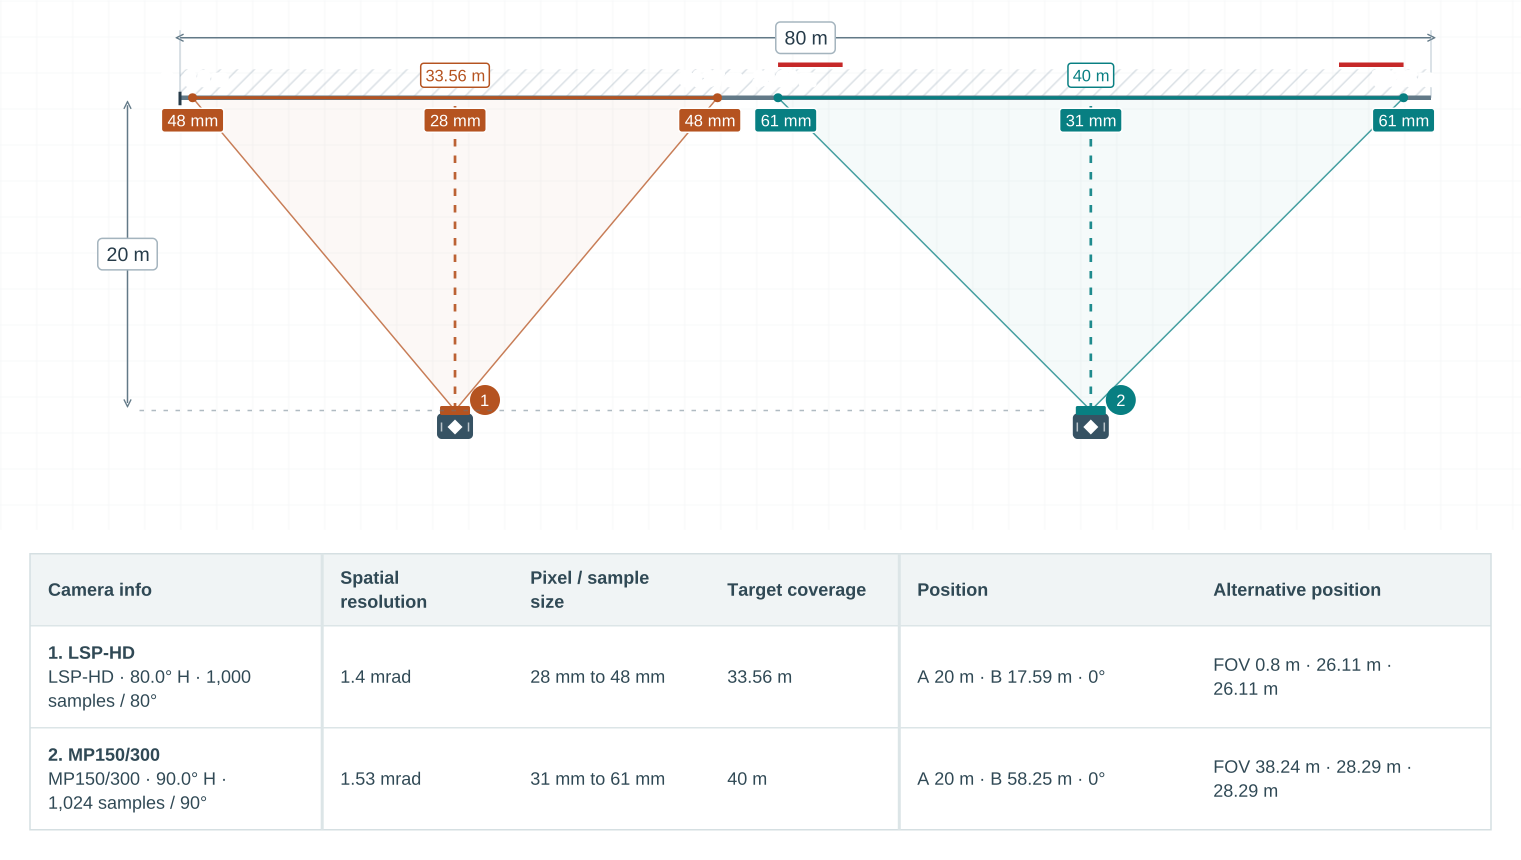
A 100 mm feature spans at least two sample footprints throughout the LSP-HD view. The MP150/300 meets that requirement in the center but falls below it near both edges. Use this comparison to decide whether the extra coverage is worth the coarser edge sampling, or whether a different distance or additional scanner would better meet the requirement.
From a drawing to an installation
Use these results to compare layouts, then verify the hardware and process on site. The model assumes a flat target and ideal projection geometry; it excludes obstructions, optical blur, focus limits, motion and temperature measurement errors. Passing a sampling threshold in one direction does not establish a measurement area or guarantee hot spot detection. Scanner sample spacing also differs from optical spot size.