Thermal image & sequence analysis software

IRT Analyzer R&D

Understand thermal behavior, frame by frame.

Turn thermal recordings into measurements you can explore. IRT Analyzer R&D brings live acquisition, sequence analysis, temperature plots, and data export into one workspace, helping you investigate how temperatures change over time and across an image.

Sequence analysis · Image & trend recording · Numerical export

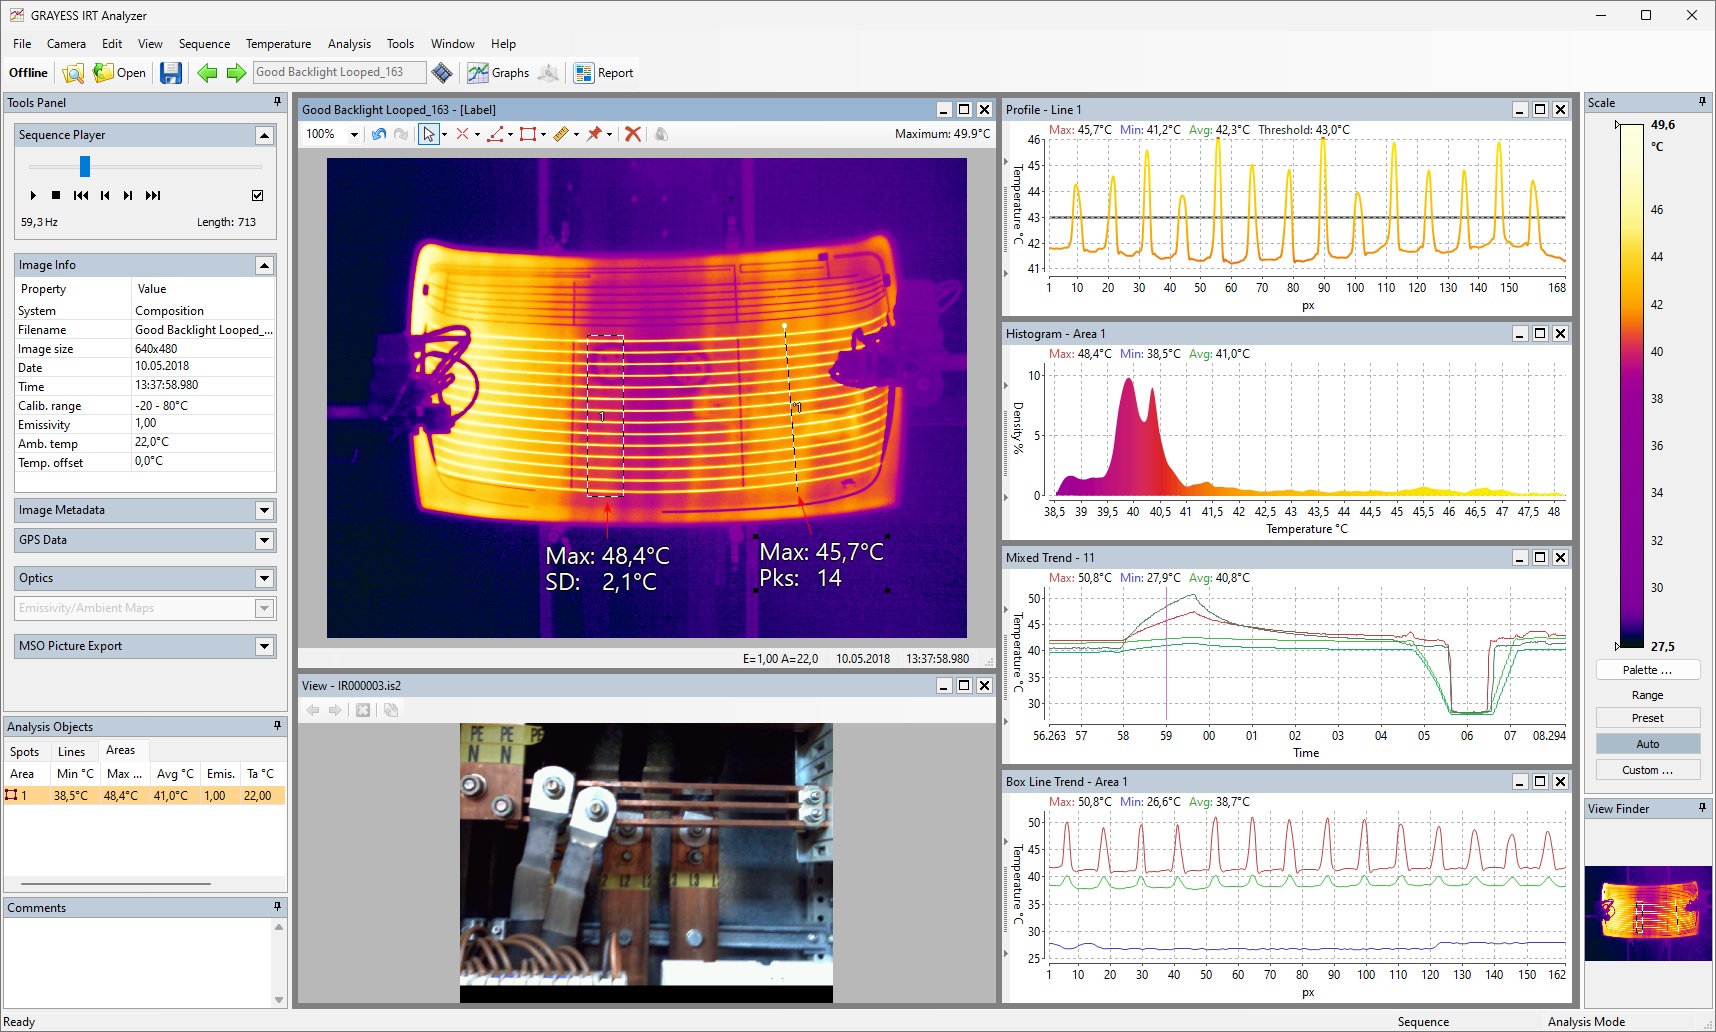
IRT Analyzer R&D displaying a thermal sequence, measurement objects, a line profile, histogram, time trend and box-line analysis

Look beyond a single frame

Capture. Analyze. Compare.

Follow changes over time, inspect temperature patterns within an image, and compare results across a recording. Keep the measurements and the thermal data together as you investigate.

Follow temperature changes through every frame.

Analyze a thermal recording with one set of measurement objects across the sequence. Plot temperatures at selected points and follow the minimum, maximum, and average within a line or area as the recording progresses.

  • Combine point and area measurements in a mixed trend to compare their behavior.
  • Open a recorded sequence or treat a series of individual thermal images as one sequence.
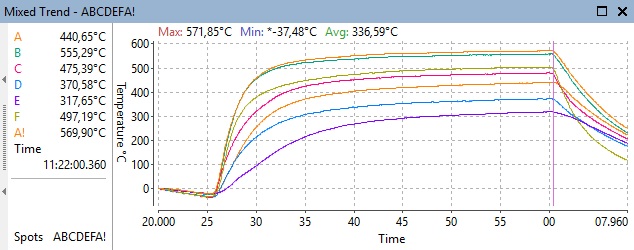
Analyzer mixed trend comparing selected temperature measurements across time
Compare selected measurements across the recording. View screenshot

Record images and measurement trends

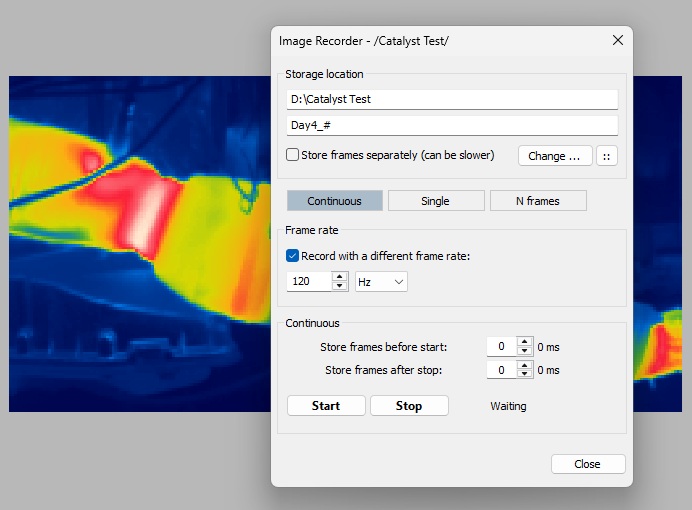
Capture thermal sequences from cameras and record selected measurement trends for later review. Set the recording interval and choose continuous capture, a single image, or a fixed number of frames.

  • Include buffered frames before Start and frames after Stop when recording continuously.
  • Start recording with external events to capture data at exactly the right moment.
Analyzer image recorder with continuous, single-image and fixed-frame modes, recording rate, and pre-start and post-stop frame settings
Choose how much data to capture and when to save it. View screenshot

See where temperatures differ

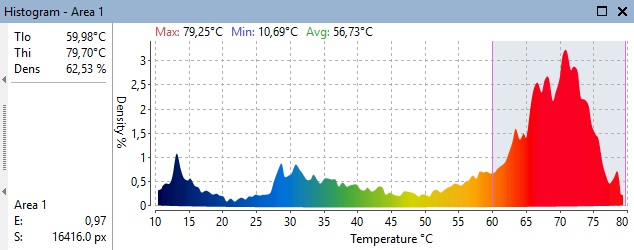
Place spots, lines, and areas on the thermal image to examine the details behind a trend. Profiles show temperatures along a line; histograms show how temperatures are distributed within an area.

  • Compare connected measurement objects and examine temperature differences.
  • Use a temperature range to select the pixels included in an area measurement.
Analyzer area histogram with a selected temperature interval and its percentage of pixels
Measure the temperature distribution within a selected area. View screenshot

See the variation across the whole sequence.

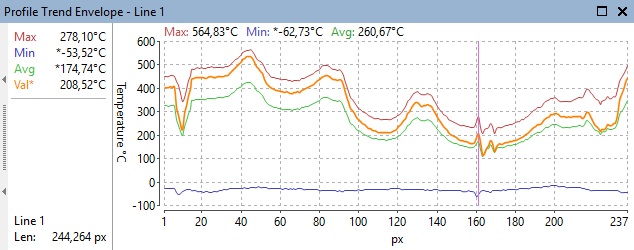
Compare the current line profile with the minimum, maximum, and average recorded at each position across the sequence. Profile envelopes reveal spatial variation that a single frame cannot show.

  • View the active-frame profile alongside the sequence envelope.
  • Use box-line analysis to summarize horizontal or vertical sections through a rectangular area.
Analyzer profile envelope showing sequence minimum, average, maximum and active-frame values along a spatial axis
Compare one frame with the range observed at each position. View screenshot

Create reports with reusable templates

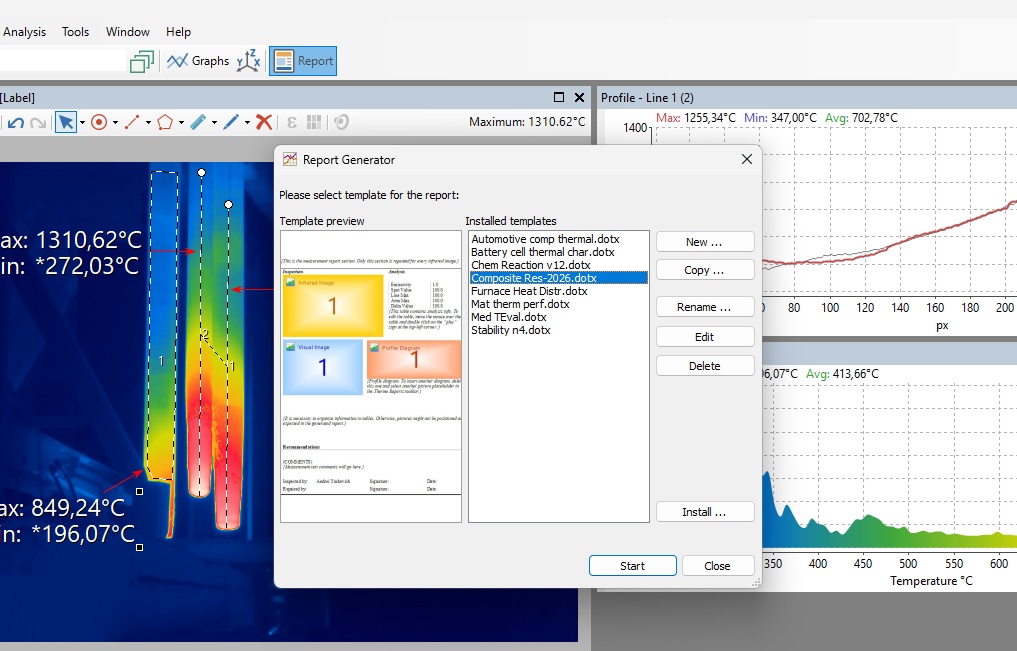
Turn prepared thermal images and their analysis into editable reports. Choose a supplied template or create your own layout for images, measurement tables, profiles, and histograms.

  • Automatically fill placeholders and repeat the report section for each prepared image.
  • Add project details in Word and reopen linked images in Analyzer when the analysis needs revising.
Analyzer Report Generator selecting a reusable Word template over a thermal image and analysis graphs
Choose a reusable report layout or customize a template in Word. View screenshot

Keep the frames that matter

Prepare recorded data for a closer look. Remove unwanted frames, add images or another sequence, sort by frame or timestamp, and save selected frames as a new sequence or separate files.

  • Summarize successive blocks of frames with average, minimum, maximum, or median aggregation.
  • Reduce the number of frames with thinning when a lower temporal resolution suits the analysis.
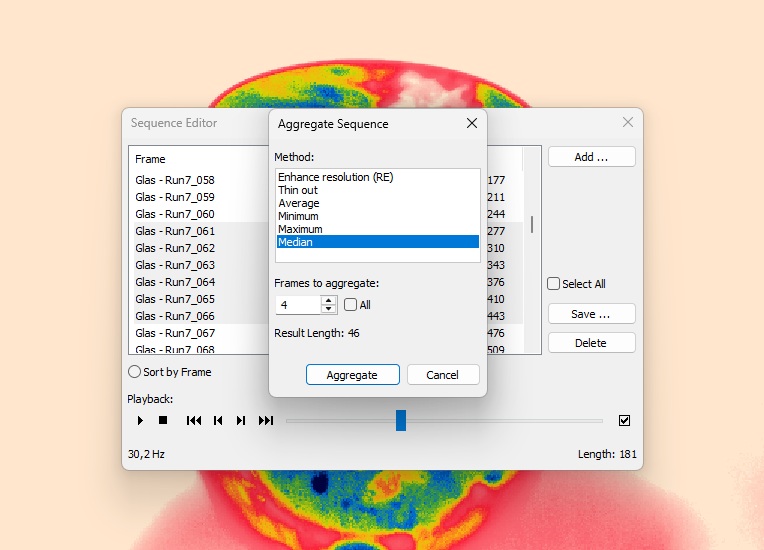
Analyzer Sequence Editor with an Aggregate Sequence dialog set to the median of four frames
Edit and aggregate frames before the next analysis. View screenshot

Explore variation with image filters

Reveal local temperature variation with the standard deviation or variance filter. Choose the neighborhood size and inspect the resulting thermal pattern alongside the original image.

  • Switch between standard deviation and variance, with a 3 × 3, 5 × 5, or 7 × 7 kernel.
  • Apply averaging, median, convolution, erosion, and dilation filters for other analysis tasks.
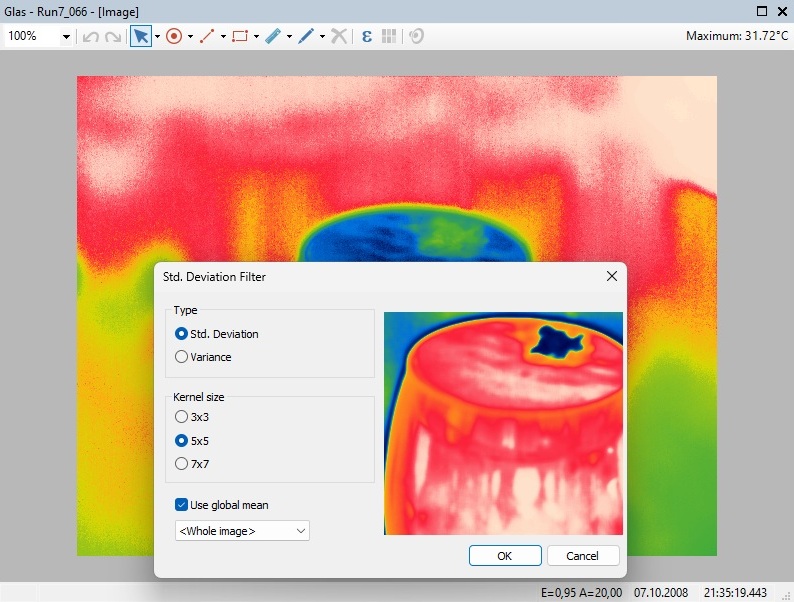
Analyzer standard deviation filter dialog over a thermal image, showing deviation and variance modes, kernel sizes, and a filtered preview
Inspect temperature variation with the standard deviation filter. View screenshot

Take the data into your next analysis

Export temperature values and graph data for further work. Save every frame in a sequence to numerical files in one operation, or share selected images, plots, and measurements in your documentation.

  • Export image data in a variety of formats, including CSV, MATLAB matrices, and simple binary files.
  • Create presentation-ready images and video clips, and export selected results to other applications.
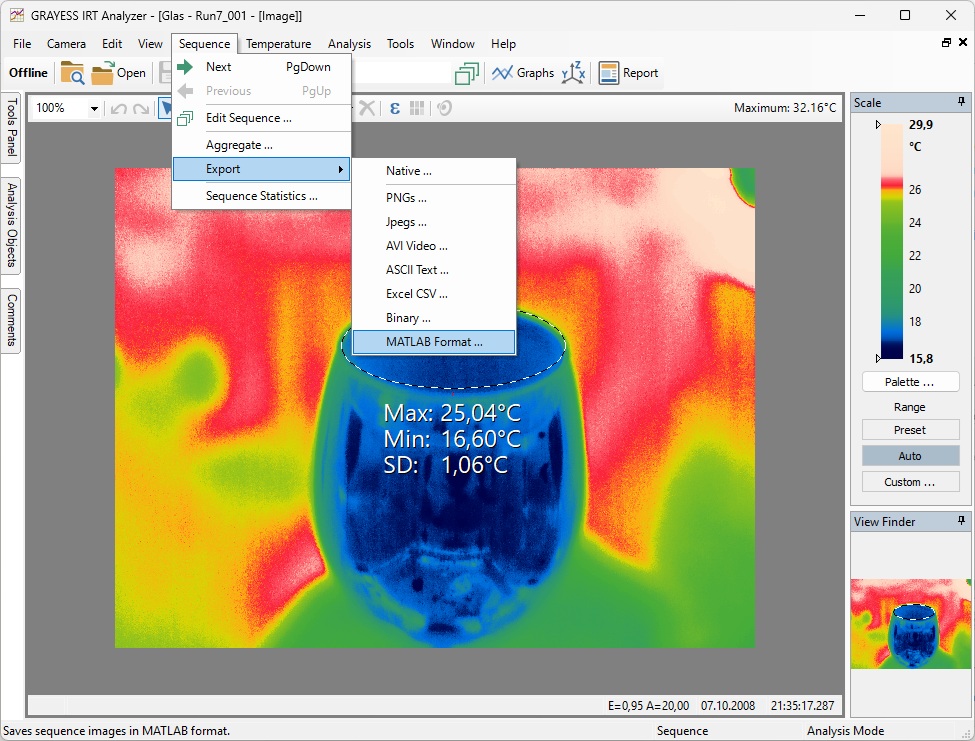
Analyzer Sequence Export menu over a thermal image, with MATLAB, CSV, ASCII, image, video, and binary output formats
Choose a format for exporting a recorded thermal sequence. View screenshot

Feature overview

A closer look at your thermal data.

Work with individual thermal images, recorded sequences, and live acquisition. Choose the measurements, corrections, and exports that fit your investigation.

Compare editions & pricing
Sequence analysis & comparison 8 features
  • One set of analysis objects across a recorded sequence
  • Point trends, area and line trends, and mixed measurement trends
  • Minimum, maximum, and average temperatures across frames
  • Profile envelopes and box-line sequence statistics with active-frame comparison
  • Reference-image subtraction for images, sequences, and live data
  • Manual alignment in the separate two-image subtraction tool
  • Sequence sorting, frame removal, joining, and selected-frame saving
  • Temporal average, minimum, maximum, median, and thinning operations
Acquisition & recording 8 features
  • Live acquisition from infrared cameras
  • Multiple camera inputs combined in one analyzed image
  • Adjustable acquisition and recording intervals
  • Cyclic image history and review of buffered frames while the live display is on hold
  • Continuous recording, snapshots, and fixed-frame-count capture
  • Buffered frames before Start and recording after Stop in continuous mode
  • Separate measurement-trend recording with configurable aggregation
  • Recorded trend review and CSV or text export
Measurements & correction 10 features
  • Spots, straight and polygonal lines, rectangles, circles, ellipses, and polygons
  • Line profiles, area histograms, and box-envelope profiles
  • Connected-object comparisons and temperature differences
  • Temperature-range selection for area measurements
  • Rulers and real-world spatial scales
  • Per-image and per-object emissivity and reflected-temperature settings
  • Emissivity and background maps from known-temperature reference images
  • Constant, table-based, and known-reference correction offsets
  • Spatial averaging, median and convolution filters, custom kernels, erosion, and dilation
  • Profile peak and valley counting against a threshold
Export & documentation 8 features
  • Saved analysis objects and diagrams associated with source images and sequences
  • Temperature-value export to ASCII, CSV, MATLAB matrices, and simple binary files
  • Batch export of sequence frames, with one output file per frame
  • Graph data and picture export
  • PNG and JPEG images, and AVI presentation movies
  • AVI export of changing profiles and histograms
  • Selected images, diagrams, and measurement data in Microsoft Word
  • Reusable Word report templates with image, diagram, and measurement placeholders

Plan your setup

Your cameras, recordings & workspace

Windows PC

Choose processor, memory, connection speed, and recording storage to suit your image resolution, frame rate, sequence length, and analysis workload. The pre-start recording span depends on the available image history.

Cameras & image formats

Check support for your camera model, connection, and recorded file format. Live acquisition and file import are separate capabilities; available controls and formats depend on the camera and license.

Check camera compatibility

Working with results

Export numerical data for use in other analysis tools. Microsoft Word must be installed locally to generate Word reports; selected frames and plots let you document the parts of a sequence that matter.

Your next investigation

Explore what your recording can tell you.

Tell us which cameras and file formats you use, and what you want to measure. We can help you assess compatibility and try IRT Analyzer R&D with your thermal data.

Product screenshot